This article covers what studies actually cost, what drives price differences, and the specific conditions under which the math clearly works in your favor.
TL;DR
- Study fees range from $2,500 to $15,000+ based on property type, size, and complexity
- ROI hinges on property value, your tax bracket, and whether you can apply accelerated deductions in the current tax year
- Properties under $500K rarely justify the cost; larger properties almost always do
- A defensible study requires engineering methodology and IRS compliance; price alone tells you nothing about accuracy
- Year of acquisition is the best time to act, but look-back studies can recover missed deductions on properties acquired as far back as 1987
How Much Does a Cost Segregation Study Cost?
Cost segregation studies don't have fixed pricing. Fees vary based on property type, size, documentation availability, and provider methodology. Misunderstanding pricing often leads investors to either overpay for basic studies or underpay for studies that don't hold up under IRS scrutiny.
| Tier | Fee Range | Typical Properties |
|---|---|---|
| Entry-Level / Smaller Residential | $2,500–$5,000 | Single-family rentals, small multi-family (2–4 units), properties under $1M |
| Mid-Range / Standard Commercial and Multi-Family | $5,000–$10,000 | Large commercial buildings, industrial facilities, medical offices, hotels, manufacturing facilities |
Entry-Level / Smaller Residential Properties ($2,500–$5,000)
This tier covers:
- Single-family rentals and small multi-family properties (2–4 units)
- Properties valued under $1 million
- Standard component classifications with no specialized systems
At this level, investors typically reclassify 20–30% of depreciable basis into accelerated schedules, generating first-year deductions of $40,000–$75,000 depending on property specifics. It's a practical entry point for owners of single rental properties or investors testing cost segregation for the first time.
Mid-Range / Standard Commercial and Multi-Family ($5,000–$10,000)
Properties at this tier typically include:
- Large commercial buildings and industrial facilities
- Medical offices with specialized plumbing or equipment systems
- Hotels and hospitality properties
- Custom manufacturing facilities with built-in infrastructure
These studies require deep engineering expertise, multi-discipline analysis, and extensive documentation. They're best suited for institutional investors, syndicators, and owners of specialized build-outs where tax savings far exceed the study fee.
Important Note: The IRS Cost Segregation Audit Technique Guide flags contingency-based pricing (fees tied to tax savings achieved) as a red flag. Transparent, fixed-fee pricing models avoid the audit scrutiny associated with contingency-based fees.
Key Factors That Drive the Cost of a Study
Pricing is driven by property complexity, documentation quality, and provider methodology, not by brand prestige or firm size alone.
| Factor | Impact on Cost |
|---|---|
| Property Type and Complexity | More specialized systems require more analysis time and cost |
| Property Size and Value | Larger properties have more components; fees should not scale linearly with value |
| Documentation Availability | Missing records require cost reconstruction using databases like R.S. Means, adding 1–2 weeks |
| Provider Methodology and Credentials | Engineering-based studies take more time than rule-of-thumb or software-only approaches |
Property Type and Complexity
Different property types require varying levels of engineering analysis. A warehouse with standard construction needs less analysis than a hotel with guest rooms, restaurants, fitness centers, and conference facilities. Specialized systems (HVAC serving specific equipment, medical gas lines, commercial kitchen ventilation, or manufacturing process piping) add time and cost because each requires individual classification and valuation.
Property Size and Value
Larger properties have more components to analyze, increasing labor requirements. However, price shouldn't scale linearly with property value. A $3M apartment complex and a $5M apartment complex of similar design may require nearly identical analysis effort; providers whose fees increase proportionally with purchase price rather than actual complexity may not reflect the actual scope of work.
Documentation Availability
Properties with complete construction records, blueprints, and contractor invoices enable faster, more accurate studies. Older properties or those with missing records require engineers to reconstruct costs using industry databases like R.S. Means, which can increase cost and timeline by 1–2 weeks.
Provider Methodology and Credentials
Engineering-based studies, the IRS-preferred standard, require licensed engineers or construction professionals and take more time than rule-of-thumb or software-only approaches. The IRS evaluates studies on 13 defined quality elements, none of which relate to price. What matters is methodology, documentation, and technical accuracy.
The most auditor-relevant elements from that list include:
- Preparation by qualified experts with construction or engineering backgrounds
- Detailed methodology description with supporting documentation
- Engineering take-offs with unit costs and cost reconciliation to actual totals
- Legal analysis explaining property classifications
- Section 1245 property identification
- Consideration of related tax aspects
The full criteria are outlined in the IRS Publication 5653.
When Is a Cost Segregation Study Worth It?
Cost isn't the only number that matters. What matters is the ratio of tax savings achieved to study fee paid. ROI is the primary decision framework.
The Basic ROI Framework
Calculate your potential benefit:
- (estimated first-year accelerated depreciation) × (your effective tax rate) = first-year tax savings
- If that number is at least 3–5x the study fee, the study is worth it
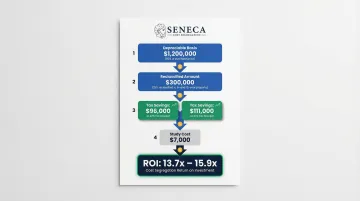
Example: A $1.5M residential rental with $1.2M depreciable basis (80% of purchase price after excluding land). Assume 25% of basis ($300,000) gets reclassified to 5- and 15-year property. With 100% bonus depreciation available for property placed in service after January 19, 2025:
- Accelerated deduction: $300,000
- Tax savings at 32% bracket: $96,000
- Tax savings at 37% bracket: $111,000
- Study cost: ~$7,000
- ROI: 13.7x to 15.9x in year one alone
Property Value Threshold
Cost segregation typically makes financial sense for properties valued at $500,000 or more. Below that threshold, study fees often approach or exceed realistic first-year benefits. Commercial properties with high improvement ratios (low land value, high building value) can justify studies at lower values.
According to data from over 8,000 studies, properties typically see 20–30% of depreciable basis reclassified, with specialty properties reaching 30–50% or higher.
Investor Tax Profile
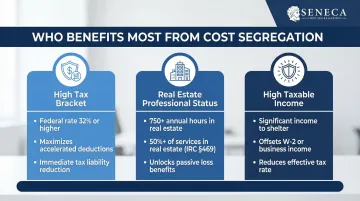
The study delivers maximum value to investors who check at least one of these boxes:
- High effective tax rate (32% federal bracket or higher): more accelerated depreciation means more tax saved per dollar reclassified
- Real estate professional status under IRC §469(c)(7): passive losses can offset active W-2 income, which requires more than 50% of personal services in real property trades and more than 750 hours of material participation annually
- Significant taxable income to offset: bonus depreciation deductions only generate value if you have income they can shelter
W-2 earners without real estate professional status face passive activity loss limitations. Under IRC §469, rental activities are per se passive, so losses can only offset passive income unless you meet the professional tests. That distinction determines how much of the study's value you can actually use.
The Bonus Depreciation Factor
With 100% bonus depreciation restored under the One Big Beautiful Bill Act (H.R.1, Section 70301) for property placed in service after January 19, 2025, the timing advantage is at its peak. Qualifying personal property and land improvements can be written off entirely in Year 1 rather than spread over 5–15 years, amplifying first-year ROI.
The TCJA phase-down is still in effect. If a taxpayer acquired a property before January 19, 2025, and places it into service after January 19, 2025 in 2025 or 2026, they will experience 40% bonus depreciation and 20% bonus depreciation, respectively.
That makes right now one of the strongest environments in years for a cost segregation study, especially for recently acquired properties.
Bonus Depreciation Timeline
| Period | Bonus Depreciation Rate |
|---|---|
| September 27, 2017 – December 31, 2022 | 100% |
| January 1, 2023 – December 31, 2023 | 80% |
| January 1, 2024 – December 31, 2024 | 60% |
| January 1, 2025 – January 18, 2025 | 40% |
| January 19, 2025 – December 31, 2030 (acquisition date on or after January 19, 2025) | 100% |
| 2025 (acquisition date before January 19, 2025) | 40% |
| 2026 (acquisition date before January 19, 2025) | 20% |
Look-Back Studies: Capturing Missed Deductions
Investors who didn't get a study at acquisition aren't locked out. A look-back study allows a catch-up deduction via IRS Form 3115 for the difference between what was depreciated and what could have been. This can be claimed in a single year through a Section 481(a) adjustment.
Properties acquired as far back as January 1, 1987 (the inception of MACRS) qualify for look-back studies. You don't amend prior returns; the entire catch-up deduction hits your current year return.
What You Get at Different Price Points (And What to Watch Out For)
Price and quality don't move in lockstep in this industry. The IRS evaluates methodology, documentation, and technical accuracy, not how much a firm charges.
Large firms with high overhead (office space, marketing teams, sales staff) often pass those costs to clients without improving study quality. Smaller, specialized providers with efficient processes and modern technology can deliver fully IRS-compliant results at a lower price point.
| Signs of a Quality Study | Red Flags Indicating Poor Quality |
|---|---|
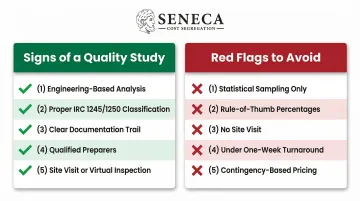
| Engineering-based component analysis (not statistical sampling or rule-of-thumb percentages) | Studies using only statistical sampling without property-specific analysis |
| Proper IRC Section 1245 vs. 1250 classification with legal analysis | Rule-of-thumb percentages applied without engineering justification |
| Clear documentation trail including photos, blueprints, and cost reconciliation | No site visit or document review |
| Qualified preparers with construction or engineering backgrounds | Completed in under one week (insufficient analysis depth) |
| Site visit or thorough virtual inspection with detailed documentation | Contingency-based pricing flagged by the IRS as creating incentive for aggressive classifications |
That last red flag carries real weight. The IRS explicitly warns that "rule of thumb" approaches (those using fixed percentages with little or no documentation) lack the substantiation needed to hold up under audit scrutiny.
What to Look for in a Cost Segregation Provider
Credentials matter more than price. Key signals of a quality provider:
Professional Credentials:
- CCSP (Certified Cost Segregation Professional) designation from the American Society of Cost Segregation Professionals (ASCSP), which requires 7,000 hours of experience, 7 years in the field, and passing a rigorous exam
- Licensed professional engineers on staff
- Track record of completed studies across multiple property types
- Clear fixed-fee structure
Turnaround Time and Audit Support
A reasonable study timeline is 2–4 weeks for standard properties. Whether providers offer audit defense if the IRS challenges the study's conclusions is a relevant factor in provider selection. Providers who stand behind their work with written guarantees demonstrate accountability.
A firm meeting all these criteria looks like this in practice: Seneca Cost Segregation completes studies in 2–4 weeks, backs every study with AuditDefense and a money-back guarantee, and applies engineering-driven analysis across 10,200+ properties nationwide. For context, their clients average $171,243 in first-year deductions.
Red Flags to Avoid
- Contingency-based pricing
- No engineering credentials listed
- Inability to provide sample redacted reports
- Unusually fast turnaround promises (under one week) suggesting insufficient analysis
- Providers unwilling to explain their methodology in detail
Common Mistakes Investors Make When Evaluating Cost Segregation Studies
Two mistakes account for most of the missed value in cost segregation decisions:
Chasing the lowest fee instead of the best ROI. Choosing a cheap provider without verifying their methodology is a false economy. An IRS challenge triggered by a shoddy study can cost far more in penalties, interest, and back taxes than the original fee savings. On the flip side, overpaying a large national firm doesn't improve compliance or produce larger deductions; it just inflates the cost.
Waiting, or skipping the study entirely. Deferral is the costliest mistake. Every year without a cost segregation study on a qualifying property is a year of tax savings permanently forfeited. A look-back study may recover those deductions before the next tax filing for investors with properties acquired in the past several years.
Conclusion
Cost segregation study fees range from $2,500 to $25,000+, but the fee itself is rarely the deciding factor. For properties valued above $500,000, the ROI math almost always favors the study — particularly for investors with meaningful taxable income who can put accelerated depreciation to work right away.
Choosing a provider comes down to three things:
- Engineering-grade methodology backed by licensed professionals, not software estimates
- IRS-compliant documentation that holds up under audit scrutiny
- Transparent pricing from a credentialed firm: not the cheapest or most expensive option, but the most defensible
With 100% bonus depreciation available for property acquired and placed in service on or after January 19, 2025, investors in that category can front-load deductions that would otherwise stretch across 27.5 to 39 years. That's a narrow window worth taking seriously.
Frequently Asked Questions
Is a cost segregation study worth it?
For most real estate investors with properties valued above $500,000, the first-year tax savings substantially exceed the study fee, often by 5x to 20x or more, making it one of the highest-ROI tax strategies available.
Is furniture included in a cost segregation study?
Yes, personal property such as furniture, appliances, and fixtures can be identified and reclassified in a cost segregation study. This enables accelerated depreciation over 5–7 years rather than the standard 27.5 or 39.
What is the minimum property value for a cost segregation study to make sense?
Most professionals recommend a minimum property value of $500,000. That said, commercial properties with high improvement ratios, or investors in higher tax brackets, may find it worthwhile starting at $300,000–$400,000 in depreciable basis.
Can I do a cost segregation study on a property I've owned for years?
Yes. A look-back study lets investors claim a catch-up deduction for all accelerated depreciation missed since acquisition, captured in a single tax year. This is filed via IRS Form 3115 and applies to properties acquired as far back as 1987.
How long does a cost segregation study take?
A typical study takes 2–6 weeks depending on property complexity, documentation availability, and provider efficiency, with engineering-based firms often delivering results in 2–4 weeks.
Does a cheaper cost segregation study increase IRS audit risk?
IRS audit risk depends on methodology quality and documentation, not the fee paid. A well-executed study from a credentialed provider is just as defensible as a high-priced one, provided it meets the 13 quality elements outlined in the IRS Audit Technique Guide.