Introduction
Rental property investing offers two core financial benefits: monthly cash flow and long-term appreciation. Yet the decision to invest carries real financial risk: down payments typically start at 15–20% of the purchase price, vacancies can drain cash flow quickly, and unexpected repairs can wipe out months of profit. According to ATTOM's 2026 Single-Family Rental Market Report, rental yields declined in 54.8% of U.S. counties as home prices outpaced rent growth, making property selection a make-or-break decision for first-year returns.
This guide walks you through the complete evaluation process:
- Weighing the pros and cons of rental ownership
- Calculating key metrics like cap rate and cash-on-cash return
- Understanding the step-by-step buying process
- Maximizing tax advantages through depreciation strategies
- Avoiding common beginner mistakes that turn promising deals into cash drains
TLDR
- Rental properties offer two income streams (monthly cash flow and long-term appreciation) along with tax advantages stocks and bonds can't match
- Quick screening rules (2% rule, 50% rule) help identify profitable properties before deeper analysis
- A 6-10% cash-on-cash return target compensates for concentrated risk and illiquidity
- Cost segregation can turn 20-40% of property costs into accelerated deductions, boosting first-year cash flow
- Success requires choosing high-demand markets, accurate expense forecasting, and understanding landlord-tenant laws
Is Rental Property a Good Investment? Pros and Cons
Rental property investing differs fundamentally from stocks or bonds by providing two distinct return channels: recurring rental income that arrives monthly, and long-term property appreciation that builds equity over years. This dual-income structure, combined with leverage through mortgages, creates wealth-building potential that paper assets rarely match.
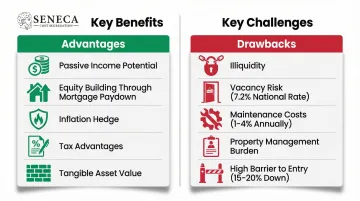
Key advantages include:
- Passive income potential - Monthly rent payments create recurring cash flow, though "passive" is misleading without a property manager
- Equity building through mortgage paydown - Tenants effectively pay down your loan principal each month while you retain ownership
- Inflation hedge - The S&P/Case-Shiller U.S. National Home Price Index reached 332.037 in December 2025, reflecting long-term growth that historically outpaces inflation
- Tax advantages - Rental income avoids Social Security tax, and depreciation deductions offset taxable income
- Tangible asset with intrinsic value - Unlike stocks that can drop to zero, real estate holds inherent utility and scarcity value
Every advantage comes with a trade-off. Before committing capital, weigh these risks honestly:
Significant drawbacks to consider:
- Illiquidity - Selling property takes months and costs 6-10% in transaction fees, unlike stocks that sell instantly
- Vacancy risk - The national rental vacancy rate hit 7.2% in Q4 2025, meaning your mortgage continues even when units sit empty
- Ongoing maintenance costs - Industry standards suggest setting aside 1-4% of property value annually for repairs, with 92% of landlords citing maintenance as their top burden
- Property management burden - Self-managing means handling tenant vetting, lease enforcement, maintenance coordination, and legal compliance
- Higher barrier to entry - Investment properties require 15-20% down payments and face stricter credit qualification than primary residences
| Pros | Cons |
|---|---|
| Passive income potential – Monthly rent payments create recurring cash flow | Illiquidity – Selling property takes months and costs 6-10% in transaction fees |
| Equity building through mortgage paydown – Tenants effectively pay down loan principal while the owner retains ownership | Vacancy risk – The national rental vacancy rate hit 7.2% in Q4 2025 |
| Inflation hedge – The S&P/Case-Shiller U.S. National Home Price Index reached 332.037 in December 2025 | Ongoing maintenance costs – Industry standards suggest 1-4% of property value annually |
| Tax advantages – Rental income avoids Social Security tax, and depreciation deductions offset taxable income | Property management burden – Self-managing means handling tenant vetting, lease enforcement, maintenance coordination, and legal compliance |
| Tangible asset with intrinsic value – Unlike stocks that can drop to zero, real estate holds inherent utility and scarcity value | Higher barrier to entry – 15-20% down payments and stricter credit qualification than primary residences |
The "Passive Income" Misconception
Being a landlord involves real work. Tenant screening requires background checks and credit analysis. Maintenance requests arrive at inconvenient times, and lease violations demand enforcement.
Legal compliance with fair housing laws and local regulations carries serious liability. Unless you hire a property manager (which typically costs 8-12% of monthly rent), rental income requires consistent, active attention.
The investors who succeed long-term treat rental property as a business, not a set-it-and-forget-it income stream. Understanding the full cost picture, including taxes, is where returns are often won or lost.
Key Financial Metrics for Evaluating a Rental Property
The 50% Rule
This quick screening tool assumes approximately 50% of gross rental income will go toward operating expenses (excluding mortgage payments). It helps investors estimate net operating income without deep analysis. For example, a property generating $2,000/month in rent would have roughly $1,000/month available for mortgage payments and profit after expenses.
The 50% rule covers:
- Property taxes and insurance
- Maintenance and repairs
- Vacancy losses
- Property management fees
- Other recurring operating costs
It's a conservative benchmark, useful for quick screening, but not a substitute for detailed underwriting once a deal looks promising.
The 2% Rule
A property passes this initial screen if monthly rent equals at least 2% of the purchase price. For example, a $100,000 property should rent for $2,000/month to meet this threshold.
This rule is increasingly difficult to achieve in high-cost markets. It serves as an entry-level filter: if a property clears 2%, further analysis is warranted. If it doesn't, that's not automatically a deal-killer. Many properties in appreciating markets fall short of 2% yet still deliver strong total returns through appreciation, equity buildup, and favorable tax treatment.
Return on Investment (ROI) / Cash-on-Cash Return
This metric measures actual cash flow as a percentage of your total cash invested.
Formula: (Annual Rental Income - Annual Operating Costs) ÷ Total Cash Invested
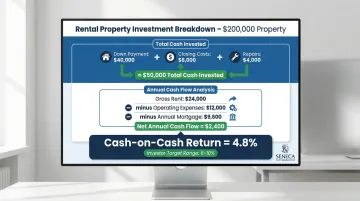
Example calculation for a $200,000 property:
- Purchase price: $200,000
- Down payment (20%): $40,000
- Closing costs: $6,000
- Upfront repairs: $4,000
- Total cash invested: $50,000
Annual income and expenses:
- Monthly rent: $2,000 × 12 = $24,000
- Operating expenses (50% rule): $12,000
- Annual mortgage payment (P&I): $9,600
- Net annual cash flow: $2,400
Cash-on-cash return: $2,400 ÷ $50,000 = 4.8%
This example shows a marginal return. Investors typically target 6-10% cash-on-cash returns to justify the risk and illiquidity of real estate. Note that this calculation uses pre-tax cash flow. Depreciation deductions and strategies like cost segregation can significantly improve your effective after-tax return on the same property.
Cap Rate (Capitalization Rate)
Cap rate measures pre-financing yield by comparing Net Operating Income (NOI) to property value, independent of financing.
Formula: Net Operating Income ÷ Property Value
Using the example above:
- Gross rental income: $24,000
- Operating expenses: $12,000
- NOI: $12,000
- Cap rate: $12,000 ÷ $200,000 = 6%
Individual investors typically target cap rates between 6-10%, while institutional buyers accept 4.75% for stabilized core multifamily assets. Small investors typically set higher return thresholds to compensate for concentrated risk and lower liquidity compared to institutional portfolios.
Healthy cap rates vary by market: Class A properties in primary markets like Boston command 4.5-4.75% cap rates, while secondary markets like Pittsburgh offer 5.5-6.5% for comparable assets. A higher cap rate generally reflects either greater perceived risk or limited appreciation potential, so context matters as much as the number itself.
| Market Type / Investor | Example | Cap Rate Range |
|---|---|---|
| Individual investor target | — | 6–10% |
| Primary market, Class A | Boston | 4.5–4.75% |
| Secondary market | Pittsburgh | 5.5–6.5% |
| Institutional buyer (stabilized core multifamily) | — | 4.75% |
How to Buy a Rental Property: Step-by-Step
Step 1: Research Locations and Rental Markets
The cheapest market is rarely the best investment. Key indicators for rental market research include:
- Vacancy rates: Markets below the national average of 7.2% are generally favorable
- Rent growth trends: Look for markets where wages support current rents and enable future increases
- Job market strength: Employment diversity and growth drive rental demand
- School district quality: Good schools support property values and attract stable tenants
- Rental demand drivers: University towns, military bases, and corporate headquarters create consistent demand
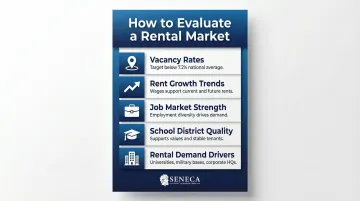
The combination of higher average rents and low vacancy rates signals a healthy rental market. ATTOM data shows that rents outpaced home price growth in 55% of markets, making market selection critical for cash flow.
Step 2: Choose the Right Property Type
Single-family homes:
- Easier to manage with one tenant
- Simpler maintenance and lower insurance costs
- Easier to sell to owner-occupants when you exit
- Lower income potential per dollar invested
Small multifamily (2-4 units):
- Multiple income streams reduce vacancy risk
- Higher revenue potential per property
- More complex management and higher maintenance costs
- Lower per-unit repair and management costs at scale
Short-term rentals:
- Significantly higher revenue potential in tourist areas
- Much higher management burden (cleaning, guest communication, frequent turnover)
- Subject to local regulations that can change suddenly
- Higher insurance and utility costs
| Property Type | Income Potential | Management Complexity | Vacancy Risk | Key Considerations |
|---|---|---|---|---|
| Single-family home | Lower per dollar invested | Low – one tenant | Higher | Simpler maintenance; easier to sell to owner-occupants; lower insurance costs |
| Small multifamily (2-4 units) | Higher per property | Moderate | Lower – multiple income streams | Lower per-unit costs at scale; higher revenue potential |
| Short-term rental | Highest in tourist areas | High – cleaning, turnover, guest communication | Variable | Subject to local regulation changes; higher insurance and utility costs |
Property type selection depends on skill set, available time, and risk tolerance. First-time investors often start with single-family homes to learn landlording basics before expanding to multifamily properties.
Step 3: Understand Financing and Down Payment Requirements
Investment properties face stricter lending standards than primary residences:
- Down payment: 15% minimum for single-family rentals, 25% for 2-4 unit properties under standard conforming guidelines
- Interest rates: Expect 0.5-0.75% higher than primary residence mortgages
- Credit and income qualification: Lenders examine debt-to-income ratios more carefully than for owner-occupied loans
- Reserve requirements: Borrowers with multiple financed properties face stringent cash reserve minimums
| Financing Factor | Single-Family Rental | 2–4 Unit Property |
|---|---|---|
| Minimum Down Payment | 15% | 25% |
| Interest Rate Premium vs. Primary Residence | 0.5–0.75% higher | 0.5–0.75% higher |
| Government-backed Loans (FHA/VA) | Not available | Not available |
| Cash Reserve Requirements | Standard | More stringent for multiple properties |
Government-backed loans don't apply: FHA and VA loans strictly require owner-occupancy within 60 days and cannot be used for non-owner-occupied investment properties. Investors must secure conventional investment property loans.
Alternative financing options:
- Home equity loans or cash-out refinances on existing properties
- Portfolio loans from local banks (more flexible underwriting)
- Seller financing in some cases
- Partnership structures to pool capital
Step 4: Estimate All Expenses Before Making an Offer
Once financing is determined, confirming the numbers actually work is essential. Accurate expense forecasting separates investors who cash flow from those who don't. These costs include:
Fixed expenses:
- Mortgage payment (principal, interest, and any PMI)
- Property taxes: Rates range from 0.27% in Hawaii to 2.23% in New Jersey, dramatically impacting cash flow
- Landlord insurance: Averages $1,516 annually nationwide but reaches $2,200-$4,600+ in high-risk states like Florida and Texas
- HOA fees (if applicable)
Variable costs tend to catch new investors off guard:
- Maintenance reserve: 1-3% of property value annually
- Property management fees: 8-12% of monthly rent if outsourced
- Utilities (if landlord-paid)
- Vacancy allowance: At least one month of vacancy per year
- Capital expenditures: Roof, HVAC, and water heater replacements over time
Underestimating these costs is the primary cause of negative cash flow. Zillow found that 31% of landlords wished they'd budgeted more for repairs, so conservative projections reflect a more realistic picture before making any offer.
Step 5: Get Pre-Approved, Make an Offer, and Close
Mortgage pre-approval process:
- Income documentation, tax returns, and asset statements are submitted to the lender
- Lender verifies credit and calculates debt-to-income ratios
- Pre-approval letter shows sellers you're a serious buyer
Making competitive offers:
- Researching comparable sales and rental rates
- Including inspection and appraisal contingencies
- Proof of funds or larger earnest money deposits may strengthen offers
After closing:
- Completing necessary repairs before tenant placement
- Thorough tenant screening (credit, background, rental history, employment verification)
- Comprehensive lease agreements that comply with local landlord-tenant laws
- Accounting systems for tracking income and expenses for tax purposes
Tax Advantages of Owning Rental Property
Rental property offers powerful tax benefits that significantly improve after-tax returns compared to most other investments.
Key Deductions Available to Rental Property Owners
The IRS allows you to deduct ordinary and necessary expenses for managing and maintaining rental property:
- Mortgage interest - Often the largest deduction
- Property taxes - Fully deductible for investment properties
- Insurance premiums - Landlord policies, flood insurance, umbrella policies
- Repairs and maintenance - Immediate deduction for routine upkeep
- Utilities - When landlord-paid
- Property management fees - Professional management costs
- Depreciation - The IRS treats residential rental property as depreciating over 27.5 years under MACRS guidelines
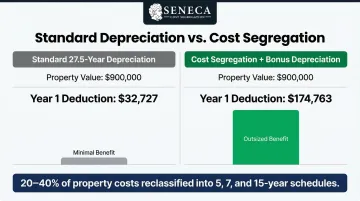
Cost Segregation: Accelerating Tax Benefits
Standard depreciation spreads deductions evenly over 27.5 years. Cost segregation accelerates these benefits by reclassifying building components into shorter depreciation schedules.
Engineering-based studies identify components that qualify as 5-year, 7-year, or 15-year property instead of 27.5-year building property:
- 5-year property: Appliances, carpeting, cabinetry, fixtures
- 7-year property: Office furniture and equipment
- 15-year property: Landscaping, fencing, paving, site improvements
Instead of deducting $32,727 in year one on a $900,000 property, cost segregation combined with bonus depreciation can generate $174,763 in first-year deductions, a 5x increase over standard depreciation alone.
The TCJA phase-down is still in effect. If a taxpayer acquired a property before January 19, 2025, and places it into service after January 19, 2025 in 2025 or 2026, they will experience 40% bonus depreciation and 20% bonus depreciation, respectively.
Bonus Depreciation Timeline
| Period | Bonus Depreciation Rate |
|---|---|
| September 27, 2017 – December 31, 2022 | 100% |
| January 1, 2023 – December 31, 2023 | 80% |
| January 1, 2024 – December 31, 2024 | 60% |
| January 1, 2025 – January 18, 2025 | 40% |
| January 19, 2025 – December 31, 2030 | 100% (if acquisition date is January 19, 2025 or later) |
If acquisition date is before January 19, 2025:
- 40% bonus depreciation applies in 2025
- 20% bonus depreciation applies in 2026
Firms like Seneca Cost Segregation use engineering-based studies to reclassify 20-40% or more of property costs into accelerated depreciation categories, with a reported average first-year deduction of $171,243 across completed studies.
Capital Gains and 1031 Exchanges
While cost segregation reduces your tax burden while you hold a property, selling triggers a separate challenge. Unlike primary residences (which offer up to $500,000 in capital gains exclusions for married couples), rental properties face full capital gains taxation when sold. IRC Section 1031 exchanges allow investors to defer these taxes by rolling sale proceeds into a like-kind property.
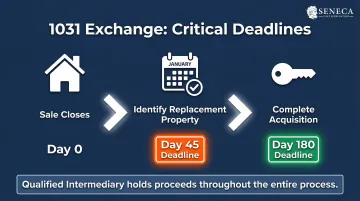
Critical 1031 timelines:
- Identify replacement property within 45 days of the sale closing
- Complete the acquisition within 180 days
- Use a qualified intermediary to hold proceeds throughout
| 1031 Exchange Requirement | Deadline / Detail |
|---|---|
| Identify replacement property | Within 45 days of sale closing |
| Complete the acquisition | Within 180 days of sale closing |
| Hold of proceeds | Qualified intermediary required throughout |
This strategy allows investors to continuously upgrade their portfolios without tax friction, compounding wealth over decades.
Common Mistakes First-Time Rental Investors Make
Underestimating Expenses
Many first-time investors budget only for mortgage payments and underestimate maintenance, vacancies, insurance, and taxes. Research shows 90% of homeowners underestimated property costs, and this problem multiplies for rental properties.
Key budget fundamentals to account for before purchasing:
- A reserve of 3-6 months of operating expenses is a common benchmark before purchasing
- 1-3% of property value annually is a minimum maintenance benchmark
- At least one month of vacancy per year is a standard budgeting assumption
- Actual insurance quotes before closing provide more accuracy than estimates
- Exact property tax rates for the specific address vary and affect cash flow projections
Skipping Market Research and Overpaying
Purchasing based on emotion or gut feel without analyzing local rental demand leads to poor cash flow. Investors who skip comparative market analysis often discover they paid $20,000-$40,000 more than market value, which erases months of projected profit before the first tenant moves in.
Steps taken before making an offer include:
- Reviewing rental comps on Zillow, Apartments.com, and local property management sites
- Calculating average price per square foot for comparable properties
- Researching vacancy trends through local apartment associations
- Verifying rent estimates through property managers who handle similar properties
- Assessing neighborhood appeal and safety at different times of day
Ignoring Landlord-Tenant Laws
Failing to understand local regulations around security deposits, eviction procedures, habitability standards, and fair housing laws exposes investors to costly legal liability. Eviction Lab data shows Atlanta, GA saw 144,003 eviction filings over 12 months—a 25% filing rate that illustrates how common tenant disputes become.
Key areas to understand before your first lease is signed:
- Security deposit limits and handling requirements (vary by state)
- Required disclosures (lead paint, mold, bed bugs in some jurisdictions)
- Fair housing compliance (protected classes, advertising restrictions)
- Eviction procedures and timelines (highly state-specific)
- Habitability standards and repair timelines
- Lease terms and renewal requirements
Real estate attorneys in the target market can review leases before purchasing. Many offer flat-fee lease reviews that identify state-specific clauses that can turn a minor tenant dispute into a months-long legal headache.
Frequently Asked Questions
Is owning a rental property a good investment?
Rental property can be a strong investment when you research markets carefully and manage expenses well, offering passive income, equity growth, and tax benefits. The tradeoffs include significant upfront capital (15-20% down), active or professional management, and less liquidity than stocks.
What rental properties are most profitable?
Small multifamily properties (2-4 units) and single-family homes in high-demand, low-vacancy markets typically offer the best balance of income and stability. Short-term rentals in tourist areas can yield higher revenue but require far more management complexity and face regulatory uncertainty.
What is the 2% rule for investment property?
The 2% rule suggests a rental property is worth screening further if monthly rent equals at least 2% of the purchase price (e.g., $2,000/month rent on a $100,000 property). This benchmark is difficult to meet in expensive coastal markets and should not be the only evaluation criterion.
What is the 50% rule in rental property?
The 50% rule estimates that roughly half of gross rental income will go toward operating expenses excluding the mortgage, helping investors quickly gauge net operating income. For example, $2,000/month in rent would yield approximately $1,000/month for mortgage payments and profit after operating expenses.
How many rental properties do I need to make $5,000 a month?
It depends on net cash flow per property. At $500-$1,000/month profit per unit, you'd need roughly 5-10 properties, but market selection and operational efficiency matter more than hitting a specific count.
What is the 3-3-3 rule in real estate?
A general homebuying guideline: property priced at no more than 3x annual income, financed on a 30-year mortgage, with housing costs below 30% of gross income. It applies to primary residences. Investment property decisions should rely on cash-on-cash return and cap rate metrics instead.