With 100% bonus depreciation now permanent for qualified property acquired after January 19, 2025, investors can write off those reclassified assets immediately rather than over decades. Understanding what goes into a cost segregation study—its components, structure, and required documentation—separates investors who maximize deductions from those who accept default treatment. This guide covers the exact template a quality study follows, the IRS compliance standards it must meet, and how to evaluate whether it will hold up under audit.
TL;DR
- Cost segregation reclassifies building components into shorter depreciation periods (5, 7, or 15 years vs. 27.5 or 39 years), accelerating deductions and improving cash flow
- A quality study follows a defined template (executive summary, asset schedules, engineering take-offs, and formal certification) built to IRS Audit Technique Guide standards
- Execution runs from document collection and site inspection through component classification and IRS Form 3115 filing for the accounting method change
- Studies deliver the greatest value for properties purchased, constructed, or renovated since 1987 with cost basis above $500,000, and can be performed retroactively through a catch-up §481(a) adjustment
What Is a Cost Segregation Study?
A cost segregation study is a federal tax analysis that allocates a property's total capitalized costs among different asset classes to maximize and accelerate allowable depreciation deductions under the Modified Accelerated Cost Recovery System (MACRS). The study separates your property into four distinct categories:
| Asset Category | Description |
|---|---|
| Land | Non-depreciable |
| §1250 real property | Building and structural components depreciated over 27.5 or 39 years |
| §1245 personal property | 5- to 7-year assets |
| Land improvements | 15-year assets |
Without a cost segregation study, the IRS defaults to depreciating your entire building over 27.5 years for residential rental property or 39 years for commercial property. Many components legally qualify for faster write-offs. Carpeting, specialized plumbing, decorative lighting, parking lots, landscaping, kitchen appliances, and dedicated electrical connections all qualify for accelerated depreciation, yet standard accounting lumps them into the building's long-term schedule. A proper study reclassifies those components, moving deductions from decades away into the first few years of ownership.
Two approaches exist depending on how you acquired the property. A newly constructed property study uses actual contractor cost records (specifically AIA G702 and G703 payment applications) to allocate costs with precision. An acquired property study uses detailed engineering cost estimates and recognized databases like RS Means or Marshall & Swift to allocate the purchase price when original construction records are unavailable.
Both approaches must be conducted by qualified individuals with engineering and tax expertise to withstand IRS scrutiny. The IRS Cost Segregation Audit Technique Guide explicitly states that studies conducted by construction engineers are more reliable than those prepared by individuals without engineering backgrounds.
Bonus Depreciation Timeline
The TCJA phase-down is still in effect. If a taxpayer acquired a property before January 19, 2025, and places it into service after January 19, 2025 in 2025 or 2026, they will experience 40% bonus depreciation and 20% bonus depreciation, respectively.
| Period | Bonus Depreciation Rate | Notes |
|---|---|---|
| September 27, 2017 – December 31, 2022 | 100% | — |
| January 1, 2023 – December 31, 2023 | 80% | — |
| January 1, 2024 – December 31, 2024 | 60% | — |
| January 1, 2025 – January 18, 2025 | 40% | — |
| January 19, 2025 – December 31, 2030 | 100% | Acquisition date must be January 19, 2025 or later |
| 2025 (acquisition before January 19, 2025) | 40% | TCJA phase-down applies |
| 2026 (acquisition before January 19, 2025) | 20% | TCJA phase-down applies |
What Does a Cost Segregation Study Template Include?
The IRS Cost Segregation Audit Technique Guide identifies 13 principal elements of a quality cost segregation study. Every well-prepared report follows this consistent structure, which is the standard for evaluating any study received or commissioned.
A complete study covers five core components:
| Component | Contents |
|---|---|
| Executive Summary | Dollar allocations by asset class |
| Narrative Report | Methodology and legal citations |
| Schedule of Assets | Organized by recovery period |
| Engineering Documentation | Supporting each classification |
| Certification, Assumptions, and Supporting Exhibits | Preparer certification, limiting conditions, and supporting exhibits |
Core Report Sections Every Quality Study Must Contain
Executive Summary / Summary Letter
The summary identifies the preparer, date, property address, and taxpayer information, then breaks out dollar amounts allocated to each asset class: land, §1250 building components, §1245 personal property, and 15-year land improvements. It gives you the financial impact in one place before you read the full report.
Narrative Report
The narrative covers your property's physical description, intended use, and the methodology applied, whether detailed engineering from actual cost records or a cost estimate approach.
It also provides legal citations supporting each asset classification. Quality studies reference relevant court cases like Hospital Corporation of America v. Commissioner and Whiteco Industries, Inc. v. Commissioner, along with IRS guidance, showing that classifications follow established precedent rather than arbitrary percentages.
Schedule of Assets and Property Units
This detailed asset-by-asset listing organizes components by recovery period — 5-year, 7-year, 15-year, 27.5-year, and 39-year categories. The schedule ties directly to your depreciation records and reconciles total allocated costs to total actual project costs. A quality study never leaves unaccounted costs; every dollar must be traced from the purchase price or construction cost through to the final asset classifications.
Engineering Procedures and Documentation
This section describes the construction drawings, contractor payment applications, site inspection findings, photographs, and interviews with property personnel used to determine unit costs.
It also explains how indirect costs (permits, contractor overhead, architectural fees, financing costs) were allocated across asset classes. This documentation is what separates classifications based on actual analysis from reports that apply generic industry percentages.
Statement of Assumptions, Certification, and Exhibits
The preparer certifies the accuracy of the analysis, discloses limiting conditions, and includes supporting exhibits such as annotated blueprints, cost source reconciliation schedules, and before-and-after photographs. These exhibits substantiate the asset classifications and provide the documentation necessary to defend the study during an IRS examination.
How a Cost Segregation Study Works – Step by Step
The most common mistakes in cost segregation occur when studies skip documentation steps, use unsupported "rule of thumb" percentages, or fail to reconcile allocated costs back to actual project costs, all red flags the IRS looks for during examination.
Step 1 – Determine Eligibility and Assess Potential Benefit
A property qualifies when it is income-producing (not a primary residence), placed in service after 1986, and has sufficient capitalized costs to justify the study cost. The industry standard minimum is typically $500,000 in depreciable basis (purchase price minus land value), though properties as low as $300,000 can justify studies in certain situations.
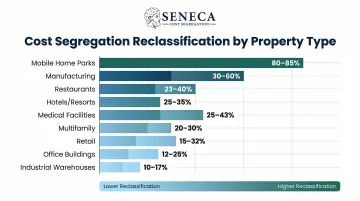
Property types that generate the highest reclassification percentages include:
| Property Type | Reclassification Range |
|---|---|
| Mobile home parks | 80–85% |
| Manufacturing facilities | 30–60% |
| Restaurants | 23–40% |
| Hotels and resorts | 25–35% |
| Multifamily with amenities | 20–30% |
| Medical facilities | 25–43% |
| Retail spaces | 15–32% |
| Office buildings | 12–25% |
| Industrial warehouses | 10–17% |
Step 2 – Gather Property Documents and Cost Data
The process involves gathering all construction contracts, contractor payment applications, architectural blueprints, purchase agreements, appraisals, general ledgers, and fixed asset records. For acquired properties where original construction records are unavailable, the engineering team relies on cost estimation guides like RS Means and site inspection findings.
Contemporaneous documentation produces the most defensible allocations, but the IRS explicitly accepts recognized cost databases when original records don't exist.
Essential documents include:
| Document | Notes |
|---|---|
| Closing statement | HUD-1 form |
| Purchase agreement | — |
| Current depreciation schedule | — |
| Property photos | Interior and exterior |
| Building plans and blueprints | If available |
| Construction invoices and contractor payment records | — |
| Renovation invoices | If applicable |
| Property appraisal and site survey | — |
Step 3 – Conduct Site Inspection and Interview Key Parties
A qualified engineer physically inspects the property (or conducts a comprehensive virtual inspection) to identify and photograph all components, understand their use and function, and verify that classifications match actual conditions. The IRS does not mandate physical on-site visits—virtual inspections using video walkthroughs are fully accepted and typically take 30-45 minutes to complete.
Interviews with the property manager, contractors, or tenants add credibility and context that documents alone cannot provide. These conversations reveal how spaces are actually used, which components serve specific business functions versus general building operation, and whether assets are easily removable or inherently permanent.
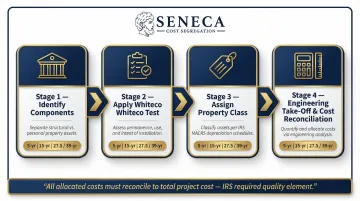
Step 4 – Classify Assets and Perform Engineering Take-Offs
Each identified component is assigned to the correct property class based on IRS definitions and the six-factor Whiteco test. The classification determines depreciation treatment:
| Asset Class | Recovery Period | Component Examples |
|---|---|---|
| §1245 Personal Property | 5-year | Carpeting and vinyl flooring installed with strippable adhesive; Kitchen appliances and laundry equipment; Decorative lighting fixtures; Dedicated electrical circuits serving specific equipment; Specialized plumbing serving equipment (not general building use); Removable wall coverings and non-permanent finishes |
| 15-Year Land Improvements | 15-year | Parking lots and paving; Sidewalks and exterior walkways; Fencing and gates; Site lighting illuminating parking areas; Landscaping (trees, shrubs, irrigation systems); Exterior signage |
| §1250 Structural Building Components | 27.5 or 39-year | Walls, roof, and foundation; HVAC systems serving general building operation; Permanent floor coverings (poured concrete, tile set in mortar); Structural plumbing and electrical serving the building; Elevators and escalators |
Engineering "take-offs" calculate the unit cost of each asset by measuring quantities and applying costs from actual records or estimation guides. These costs are then reconciled to the total project cost to ensure no dollars are double-counted or missed.
That reconciliation is one of the 13 IRS-required quality elements and the clearest dividing line between an audit-defensible study and an unsupported estimate.
Step 5 – Prepare the Formal Report and File Form 3115
The engineer compiles all findings into the quality study report format with complete asset schedules, legal support, and cost reconciliation. If you've owned the property for more than one year without the benefit of cost segregation, you file IRS Form 3115 (Application for Change in Accounting Method) to claim catch-up depreciation in a single year via a §481(a) adjustment.
This is an automatic method change under Rev. Proc. 2025-23 and Rev. Proc. 2015-13 in most cases and does not require amending prior returns. The §481(a) adjustment represents the difference between the depreciation you actually took and the depreciation you would have taken had the property been properly segregated from day one. You claim this entire difference as a deduction in the current tax year.
Cost Segregation Study Example Walkthrough
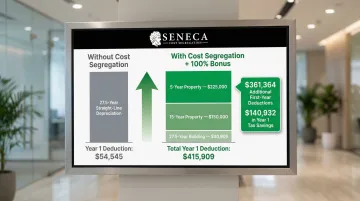
Here's a realistic example of how cost segregation transforms tax outcomes for a 12-unit multifamily apartment building acquired for $1,500,000 (excluding land value), placed in service in 2026. Without a study, the full $1,500,000 depreciates over 27.5 years at roughly $54,545 per year.
The Reclassification Process
The engineering-based study identifies and separately values key components:
| Asset Class | Recovery Period | Component | Value |
|---|---|---|---|
| Personal Property (§1245) | 5-year | Carpeting and vinyl flooring | $45,000 |
| Personal Property (§1245) | 5-year | Kitchen appliances (ranges, refrigerators, dishwashers) | $72,000 |
| Personal Property (§1245) | 5-year | Laundry equipment (washers, dryers) | $36,000 |
| Personal Property (§1245) | 5-year | Decorative lighting fixtures | $28,000 |
| Personal Property (§1245) | 5-year | Dedicated electrical connections to appliances | $44,000 |
| 5-Year Property Subtotal | $225,000 | ||
| Land Improvements | 15-year | Parking area paving and striping | $65,000 |
| Land Improvements | 15-year | Landscaping and irrigation | $35,000 |
| Land Improvements | 15-year | Site lighting | $25,000 |
| Land Improvements | 15-year | Fencing and gates | $25,000 |
| 15-Year Property Subtotal | $150,000 | ||
| Building Structure (§1250) | 27.5-year | Remaining structural components, walls, roof, foundation, general HVAC, plumbing, and electrical systems | $1,125,000 |
| Total | $1,500,000 |
The Tax Impact
With 100% bonus depreciation restored for property placed in service in 2025 and beyond, the reclassified 5-year and 15-year property can be fully expensed in Year 1:
Year 1 Depreciation Calculation:
| Asset Class | Calculation | Year 1 Deduction |
|---|---|---|
| 5-year property with 100% bonus | $225,000 × 100% | $225,000 |
| 15-year property with 100% bonus | $150,000 × 100% | $150,000 |
| 27.5-year building (straight-line) | $1,125,000 ÷ 27.5 | $40,909 |
| Total Year 1 deduction | $415,909 |
Compared to the $54,545 baseline, this study generates $361,364 in additional first-year deductions, producing $140,932 in Year 1 tax savings at a combined federal and state rate of 39%. That figure is consistent with Seneca's client average of $171,243 in first-year deductions across all property types, making this a realistic outcome rather than a theoretical maximum.
What Makes This Example Defensible
A study that holds up under IRS scrutiny requires specific documentation. This example includes:
- Annotated blueprints identifying each classified component
- Contractor pay applications confirming individual costs
- A site inspection report with supporting photographs
- A full cost reconciliation: $225,000 + $150,000 + $1,125,000 = $1,500,000
That reconciliation is one of the 13 IRS-required quality elements and what separates an audit-ready study from a "rule of thumb" estimate that cannot withstand examination.
How Seneca Cost Segregation Can Help
Seneca Cost Segregation is a full-service, engineering-based provider with over 12 years of experience and more than 10,200 properties assessed across all 50 states. Their average first-year deduction of $171,243 reflects real client outcomes, not theoretical projections.
Seneca delivers IRS-compliant studies built on licensed engineers and proprietary technology developed and tested by their engineering team, producing results that hold up under IRS scrutiny.
Key Differentiators for Real Estate Investors
| Differentiator | Details |
|---|---|
| Turnaround time | Completes studies in 2-4 weeks, half the industry standard of 4-8 weeks, with rush service available in as little as one week |
| Audit defense | Includes lifetime audit defense at no extra charge; if Seneca's work causes a >5% depreciation adjustment, you receive a 100% refund of study fees |
| Credentials | Staffed by Certified Cost Segregation Professionals (CCSP) who follow all 13 IRS principal elements for cost segregation reports |
| Client satisfaction | Holds a 95% client referral rate and a 5.0 average rating built on engineering quality and responsive service |

The Seneca Process
Those differentiators are built into every engagement from the first conversation. Seneca starts with a complimentary tax assessment to determine whether a study makes financial sense for your specific property and tax situation. The assessment includes a preliminary savings estimate based on your property type, value, and tax circumstances. If projected savings significantly exceed the study cost — typically 10:1 to 25:1 returns or better — Seneca proceeds to the full study.
The engineering team handles all documentation gathering, site inspection coordination (virtual or on-site), asset classification, report preparation, and Form 3115 filing guidance. You receive a complete, audit-ready study without having to navigate the technical details alone. Seneca also coordinates directly with your CPA over 2-3 days to ensure seamless implementation of the findings in your tax return.
Conclusion
A cost segregation study is not a loophole but a federally sanctioned methodology grounded in decades of Tax Court precedent and IRS guidance. It allows real estate investors to match depreciation deductions to the actual economic life of each building component rather than accepting the IRS default treatment that ignores the reality of how buildings are constructed.
A properly prepared study follows a defined template covering engineering documentation, legal analysis, asset schedules, and cost reconciliation. The quality of that documentation determines both the size of the deductions and their ability to withstand IRS scrutiny.
Studies that hold up under examination share the same characteristics:
- Cover all 13 principal elements outlined in the IRS Audit Technique Guide
- Include full cost reconciliation tied to actual closing or construction figures
- Support every reclassification with engineering analysis, not assumed percentages
- Document legal authority for each asset class assigned
Cost segregation studies deliver the greatest value when done right the first time with a qualified engineering team. Investors who have owned eligible properties for multiple years still have the opportunity to claim catch-up depreciation retroactively through a §481(a) adjustment on Form 3115, so the window to act isn't limited to new acquisitions. With 100% bonus depreciation now permanent for qualified property acquired after January 19, 2025, investors who use a properly documented study can accelerate the full deduction into year one rather than spreading it across decades. The TCJA phase-down is still in effect. If a taxpayer acquired a property before January 19, 2025, and places it into service after January 19, 2025 in 2025 or 2026, they will experience 40% bonus depreciation and 20% bonus depreciation, respectively.
Frequently Asked Questions
What is the typical cost of a cost segregation study?
Study fees typically range from $5,000 to $15,000 depending on property type, complexity, and size, with large or highly complex properties sometimes exceeding $25,000. A properly scoped study should deliver a cost-to-benefit ratio of at least 10:1, with many studies achieving 25:1 or higher returns on investment.
How do you prepare a cost segregation study?
Preparation involves four main steps: gathering property documents (construction contracts, blueprints, payment records), conducting a site inspection, classifying each component using engineering analysis, and compiling a formal report. The final report reconciles all allocated costs to total actual costs across each asset class.
How is cost segregation calculated?
Cost segregation uses an engineering take-off: each building component is identified, priced using actual records or guides like RS Means, multiplied by quantity, and totaled by asset class. The result is a depreciation schedule showing how much of the capitalized cost belongs in each recovery period (5, 7, 15, 27.5, or 39 years).
What is an example of a cost segregation study?
A typical study reclassifies 20-40% of a building's cost as shorter-lived property. For instance, the multifamily example in this article reclassified 25% of the building cost ($375,000 of $1,500,000) into 5-year and 15-year property, generating $361,364 in additional first-year deductions compared to standard depreciation.
Who qualifies for a cost segregation study?
Any taxpaying entity that owns income-producing real property placed in service after 1986—including commercial buildings, multifamily rentals, short-term rentals, and owner-occupied business properties—may qualify. The greatest benefit typically appears on properties with a cost basis above $500,000, though properties as low as $300,000 can justify studies depending on property type and tax situation.
When is the best time to do a cost segregation study?
The ideal time is in the same year a property is acquired, constructed, or significantly renovated to capture 100% bonus depreciation on newly placed-in-service assets. Studies can also be performed retroactively using a §481(a) catch-up adjustment filed on Form 3115, with no need to amend prior-year returns.