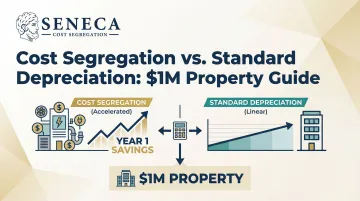
Same property value. Same tax code. Wildly different outcomes.
The difference isn't luck or aggressive accounting. It's understanding how the IRS actually allows you to depreciate real estate. Standard depreciation spreads your deductions evenly over 27.5 or 39 years. Cost segregation uses engineering analysis to reclassify 20–40% of your property into 5-, 7-, and 15-year schedules, front-loading deductions into year one when they're worth the most.
This guide breaks down both approaches with real numbers on a $1M property, showing exactly what you stand to gain—or leave on the table.
TL;DR
- Standard depreciation delivers $20,500–$29,000 annually over 27.5–39 years
- Cost segregation reclassifies 20–35% of components into 5-, 7-, or 15-year schedules
- With 100% bonus depreciation available for properties acquired and placed in service on or after January 19, 2025, first-year deductions on a $1M property can exceed $200,000
- Study costs run $5,000–$15,000 but typically return 5–10x in year-one tax savings alone
- Even with depreciation recapture at sale, the math favors cost segregation for any hold of 3+ years
Cost Segregation vs. Standard Depreciation: Quick Comparison
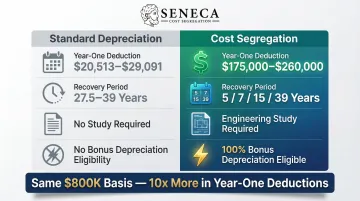
Here's how the two methods compare on a $1M property with an $800,000 depreciable basis:
| Factor | Standard Depreciation | Cost Segregation |
|---|---|---|
| Recovery Period | 27.5 yrs (residential) / 39 yrs (commercial) | Split into 5-, 7-, 15-, and 27.5/39-year components |
| Year-One Deduction | $29,091 (residential) / $20,513 (commercial) | $175,000–$260,000 depending on property type |
| Method | Straight-line IRS schedule (no study needed) | Engineering study with physical inspection and component analysis |
| Bonus Depreciation | Not eligible | 5-, 7-, and 15-year components qualify for 100% immediate expensing |
| Best For | Simple portfolios, properties under $500K, short holds | 32%+ bracket investors holding $500K+ who want maximum near-term cash flow |
What Is Standard Depreciation?
Standard depreciation, formally called Modified Accelerated Cost Recovery System (MACRS) straight-line depreciation, is the IRS default. You deduct the cost of your building (not land) evenly over a fixed number of years.
The timeline depends on property classification:
- Residential rental property: 27.5 years (if 80%+ of rental income comes from dwelling units)
- Commercial property: 39 years (everything else)
On a $1M property with $200,000 allocated to land, your depreciable basis is $800,000.
Annual deductions:
- Residential: $800,000 ÷ 27.5 = $29,091
- Commercial: $800,000 ÷ 39 = $20,513
The deduction is identical every year: no front-loading, no acceleration, no adjustment for how quickly components actually wear out.
Use Cases for Standard Depreciation
Standard depreciation makes sense when:
- Property value is below $500,000 and study costs outweigh benefits
- You're in a low tax bracket (under 32%) where timing advantage is minimal
- Holding period is under 3 years and recapture risk exceeds immediate benefit
- You prefer simplicity over optimization
Outside these scenarios, the math rarely favors standard depreciation. It treats a carpet that wears out in 5 years the same as a concrete foundation that lasts 39 years. Every component gets an identical recovery period, which is precisely the inefficiency cost segregation is designed to correct.
What Is Cost Segregation?
Cost segregation uses engineering analysis to break your property's cost basis into components with different depreciation lifespans. The total depreciable basis doesn't change; only the timing of the deductions does.
The IRS formally recognized this methodology following Hospital Corporation of America v. Commissioner (1997) and now provides examiners with an Audit Techniques Guide outlining acceptable study practices.
What Gets Reclassified
Engineering studies typically identify 20–35% of building value for reclassification:
| Recovery Period | Category | Examples |
|---|---|---|
| 5-Year | Personal Property | Carpeting and vinyl flooring; Appliances and kitchen equipment; Specialty lighting and security systems; Dedicated electrical for equipment |
| 7-Year | Office & Technology | Office fixtures and furniture; Data cabling and communication systems |
| 15-Year | Land Improvements | Parking lots and driveways; Landscaping and irrigation; Sidewalks and fencing; Exterior pole lighting |
How Bonus Depreciation Amplifies Value
Components with recovery periods of 20 years or less qualify for bonus depreciation. The One Big Beautiful Bill Act (OBBBA) restored 100% bonus depreciation for properties acquired and placed in service on or after January 19, 2025.
Bonus Depreciation Timeline
| Period | Bonus Depreciation Rate | Notes |
|---|---|---|
| September 27, 2017 – December 31, 2022 | 100% | TCJA |
| January 1, 2023 – December 31, 2023 | 80% | TCJA phase-down |
| January 1, 2024 – December 31, 2024 | 60% | TCJA phase-down |
| January 1, 2025 – January 18, 2025 | 40% | TCJA phase-down |
| January 19, 2025 – December 31, 2030 | 100% | Acquisition date must be January 19, 2025 or later |
| 2025 (acquisition before January 19, 2025) | 40% | TCJA phase-down still in effect |
| 2026 (acquisition before January 19, 2025) | 20% | TCJA phase-down still in effect |
The TCJA phase-down is still in effect. If a taxpayer acquired a property before January 19, 2025, and places it into service after January 19, 2025 in 2025 or 2026, they will experience 40% bonus depreciation and 20% bonus depreciation, respectively.
That means instead of depreciating $160,000 in 5-year property over five years, you expense the entire amount in year one.
IRS compliance matters. Quality studies require engineering-based methodology, detailed documentation (photos, floor plans, cost allocations), and reconciliation with actual purchase price. The IRS Cost Segregation ATG specifically warns against "rule of thumb" allocations without supporting analysis.
That's why engineering-based methodology, CCSP certification, and documented audit defense matter in practice. Seneca Cost Segregation has completed studies on 10,200+ properties, with an average first-year deduction of $171,243, a figure driven by rigorous documentation rather than estimates.
Use Cases for Cost Segregation
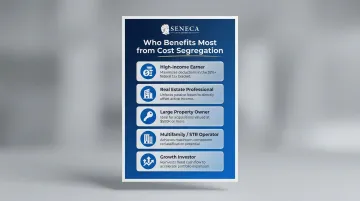
Cost segregation delivers the strongest ROI for:
- High-income earners in 32%+ tax brackets
- Real estate professionals who can offset active income with rental losses
- Properties acquired (or recently acquired) over $500,000
- Multifamily, commercial, and short-term rental operators
- Investors who want to reinvest freed-up cash into additional properties
Look-back studies allow investors who've owned properties for years to capture missed deductions in a single tax year using IRS Form 3115 (Change in Accounting Method)—no amended returns required.
Cost Segregation vs. Standard Depreciation on a $1M Property
Let's model both approaches on a $1M mixed-use property:
- Purchase price: $1,000,000
- Land allocation: $200,000 (non-depreciable)
- Depreciable basis: $800,000
- Investor tax bracket: 37%
- Placed in service: 2025 (100% bonus depreciation eligible)
Standard Depreciation Scenario (39-Year Commercial)
| Year | Annual Depreciation | Tax Savings (37%) | Cumulative Tax Savings |
|---|---|---|---|
| 1 | $20,513 | $7,590 | $7,590 |
| 2 | $20,513 | $7,590 | $15,180 |
| 3 | $20,513 | $7,590 | $22,770 |
| 4 | $20,513 | $7,590 | $30,360 |
| 5 | $20,513 | $7,590 | $37,950 |
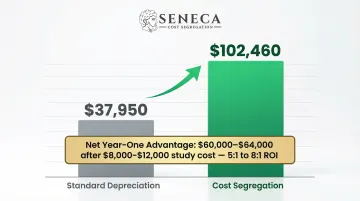
Five-year cumulative benefit: $37,950 in tax savings.
There's no study cost and no engineering engagement, but you'll spend nearly four decades waiting to fully recover your investment, surrendering the compounding value of early cash flows in the process.
Now compare that against what cost segregation does to the same property.
Cost Segregation Scenario (25% Reclassification)
Engineering study identifies the following breakdown:
- 5-year property: 20% ($160,000)
- 15-year property: 5% ($40,000)
- 39-year property: 75% ($600,000)
Year-One Calculation with 100% Bonus Depreciation:
- 5-year bonus (100%): $160,000 × 100% = $160,000
- 15-year bonus (100%): $40,000 × 100% = $40,000
- 39-year straight-line: $600,000 ÷ 39 = $15,385
- Total Year 1 Deduction: $215,385
| Year | Total Depreciation | Tax Savings (37%) | Cumulative Tax Savings |
|---|---|---|---|
| 1 | $215,385 | $79,692 | $79,692 |
| 2 | $15,385 | $5,692 | $85,384 |
| 3 | $15,385 | $5,692 | $91,076 |
| 4 | $15,385 | $5,692 | $96,768 |
| 5 | $15,385 | $5,692 | $102,460 |
Five-year cumulative benefit: $102,460 in tax savings.
The difference between the two approaches is decisive once you net out the study cost:
- First-year difference: $79,692 – $7,590 = $72,102
- Study cost: ~$8,000–$12,000
- Net year-one benefit: $60,000–$64,000
- ROI: 5:1 to 8:1 in year one alone
Depreciation Recapture: The Exit Tax
Cost segregation's front-loaded savings come with a tax obligation at exit. When you sell, the IRS recaptures accelerated depreciation:
| Property Type | Recovery Period | Tax Treatment at Sale |
|---|---|---|
| Section 1245 | 5-, 7-year | Taxed as ordinary income up to 37% |
| Section 1250 | 27.5-, 39-year | Unrecaptured gain capped at 25% |
However, having $60,000+ in hand today versus paying recapture in 7–10 years favors cost segregation. 1031 exchanges can defer recapture indefinitely, though personal property requires matching replacement property to fully defer.
Which Approach Is Right for You?
Both methods are legal and IRS-compliant. The right choice depends on your property value, tax bracket, holding period, and reinvestment goals.
| Factor | Standard Depreciation | Cost Segregation |
|---|---|---|
| Property value | Under $500,000 (study costs exceed meaningful savings) | $500,000 or above (strongest ROI above $1M) |
| Tax bracket | Under 32% (timing advantage is minimal) | 32%+ |
| Holding period | Under 3 years (recapture risk outweighs immediate benefit) | 3+ years |
| Investor profile | Simple portfolios | Real estate professionals or investors with passive income to absorb losses |
| Priority | Simplicity | Maximum near-term deductions; reinvestment of freed-up cash into additional properties or improvements |
Comparing both scenarios on a specific property provides clarity on which approach generates the stronger tax outcome. Seneca's free tax assessment does exactly that, running the numbers on your specific property so you can make an informed decision without any obligation.
Frequently Asked Questions
Should I do a cost segregation study for my property?
For properties valued at $500,000+ in a 32%+ tax bracket with a planned hold of 3+ years, cost segregation frequently generates positive ROI. A preliminary analysis comparing potential tax savings against study costs (typically $5,000–$15,000) indicates whether the ROI justifies proceeding.
Does cost segregation apply to residential property?
Yes. Cost segregation applies to residential rental properties including single-family homes, multifamily buildings, and apartment complexes. Common reclassifiable items include appliances, flooring, cabinetry, lighting fixtures, and landscaping.
What assets can be reclassified in a cost segregation study?
Three main categories qualify:
| Recovery Period | Examples |
|---|---|
| 5-year property | Carpeting, appliances, specialty lighting, security systems |
| 7-year property | Office fixtures, data cabling |
| 15-year land improvements | Parking lots, sidewalks, landscaping |
A licensed engineer determines what qualifies based on IRS guidelines and a physical inspection.
What is depreciation recapture and should I be worried about it?
Recapture taxes accelerated depreciation as ordinary income when you sell. However, the time value of money (having $50,000–$130,000 in hand today versus paying recapture in 7–10 years) typically makes cost segregation beneficial for 3+ year holds. 1031 exchanges can defer recapture indefinitely.
Can I do a cost segregation study on a property I've already owned for several years?
Yes. Look-back studies capture all missed deductions in the current tax year via Form 3115 (Change in Accounting Method). You don't amend prior returns. The IRS treats it as an accounting method change and allows a single catch-up deduction for every year of missed depreciation.
How much does a cost segregation study typically cost, and what's the ROI?
Study costs range from $5,000–$15,000 depending on property complexity. On $1M+ properties, Seneca's clients average $171,243 in first-year deductions, translating to $50,000–$80,000 in immediate tax savings for investors in higher brackets. That's a 5–10x return on the study fee in year one alone.